Visualize Peak Loads for HVAC Sizing
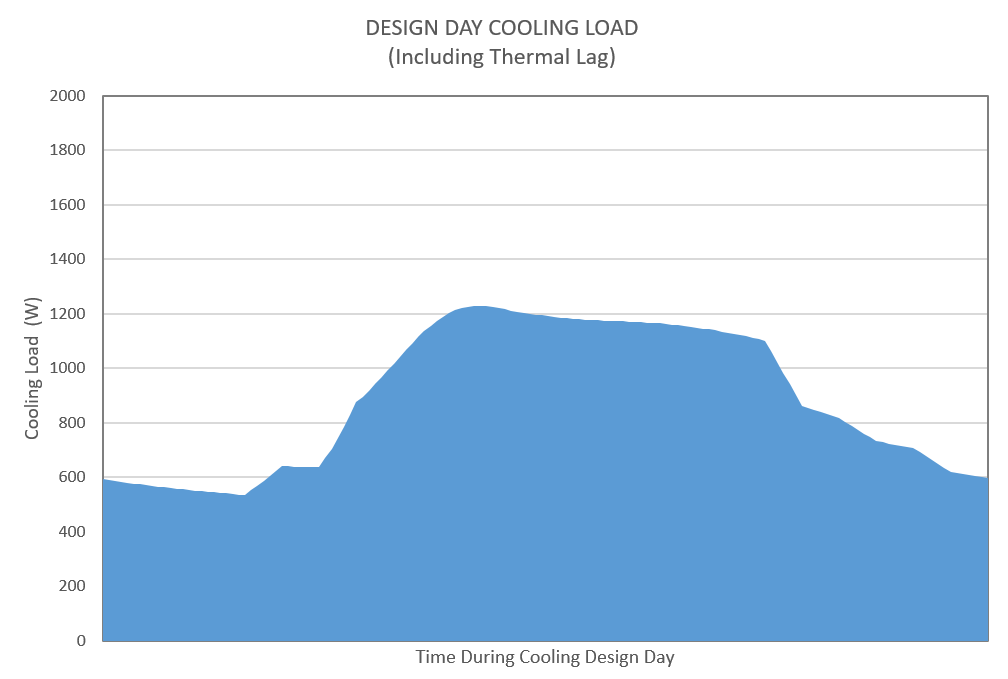
Extract the loads from the design day simulation that EnergyPlus runs to autosize HVAC equipment.
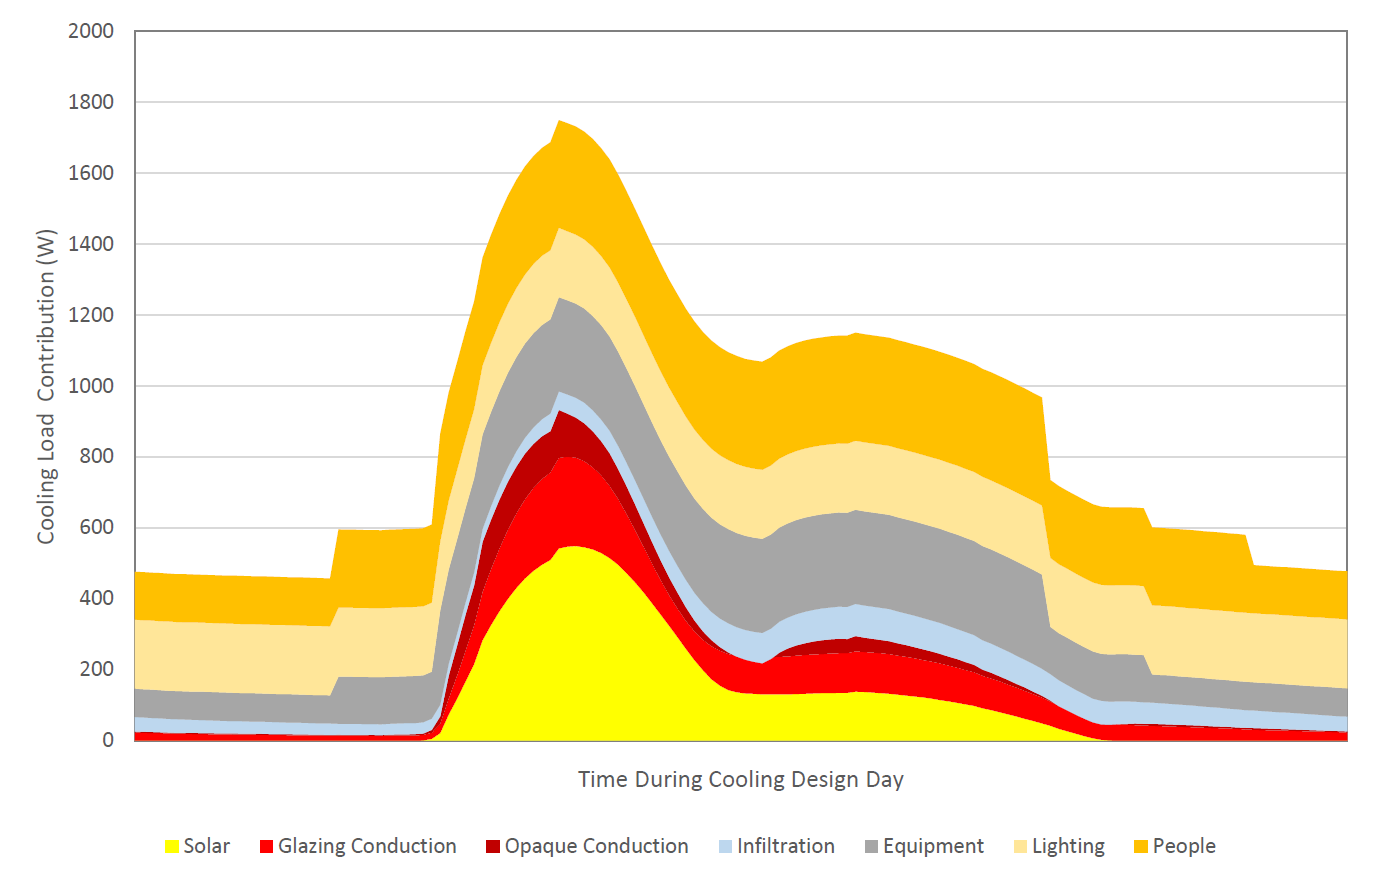
These loads are then exported to excel to be visualized on a cumulative area chart that shows the relative contribution of different heat sources to the peak cooling condition.
Such sizing visualizations are a great way to understand and illustrate the main heat sources that are contributing to HVAC size, which will help you develop strategies to keep this size down.
Note that this example file relies on Excel to produce the output chart visualization as well as TTToolbox to export results to the excel file.


